Billings, MT
Hi! Here's our summary of the Billings, The Magic City market:
Population Growth and Employment
Billings ranks 16th in population growth among our 31 markets, with a steady 1% growth rate over the past five years. However, this pace is slower than high-growth areas like Las Vegas or Phoenix.
Industrial Space and Construction
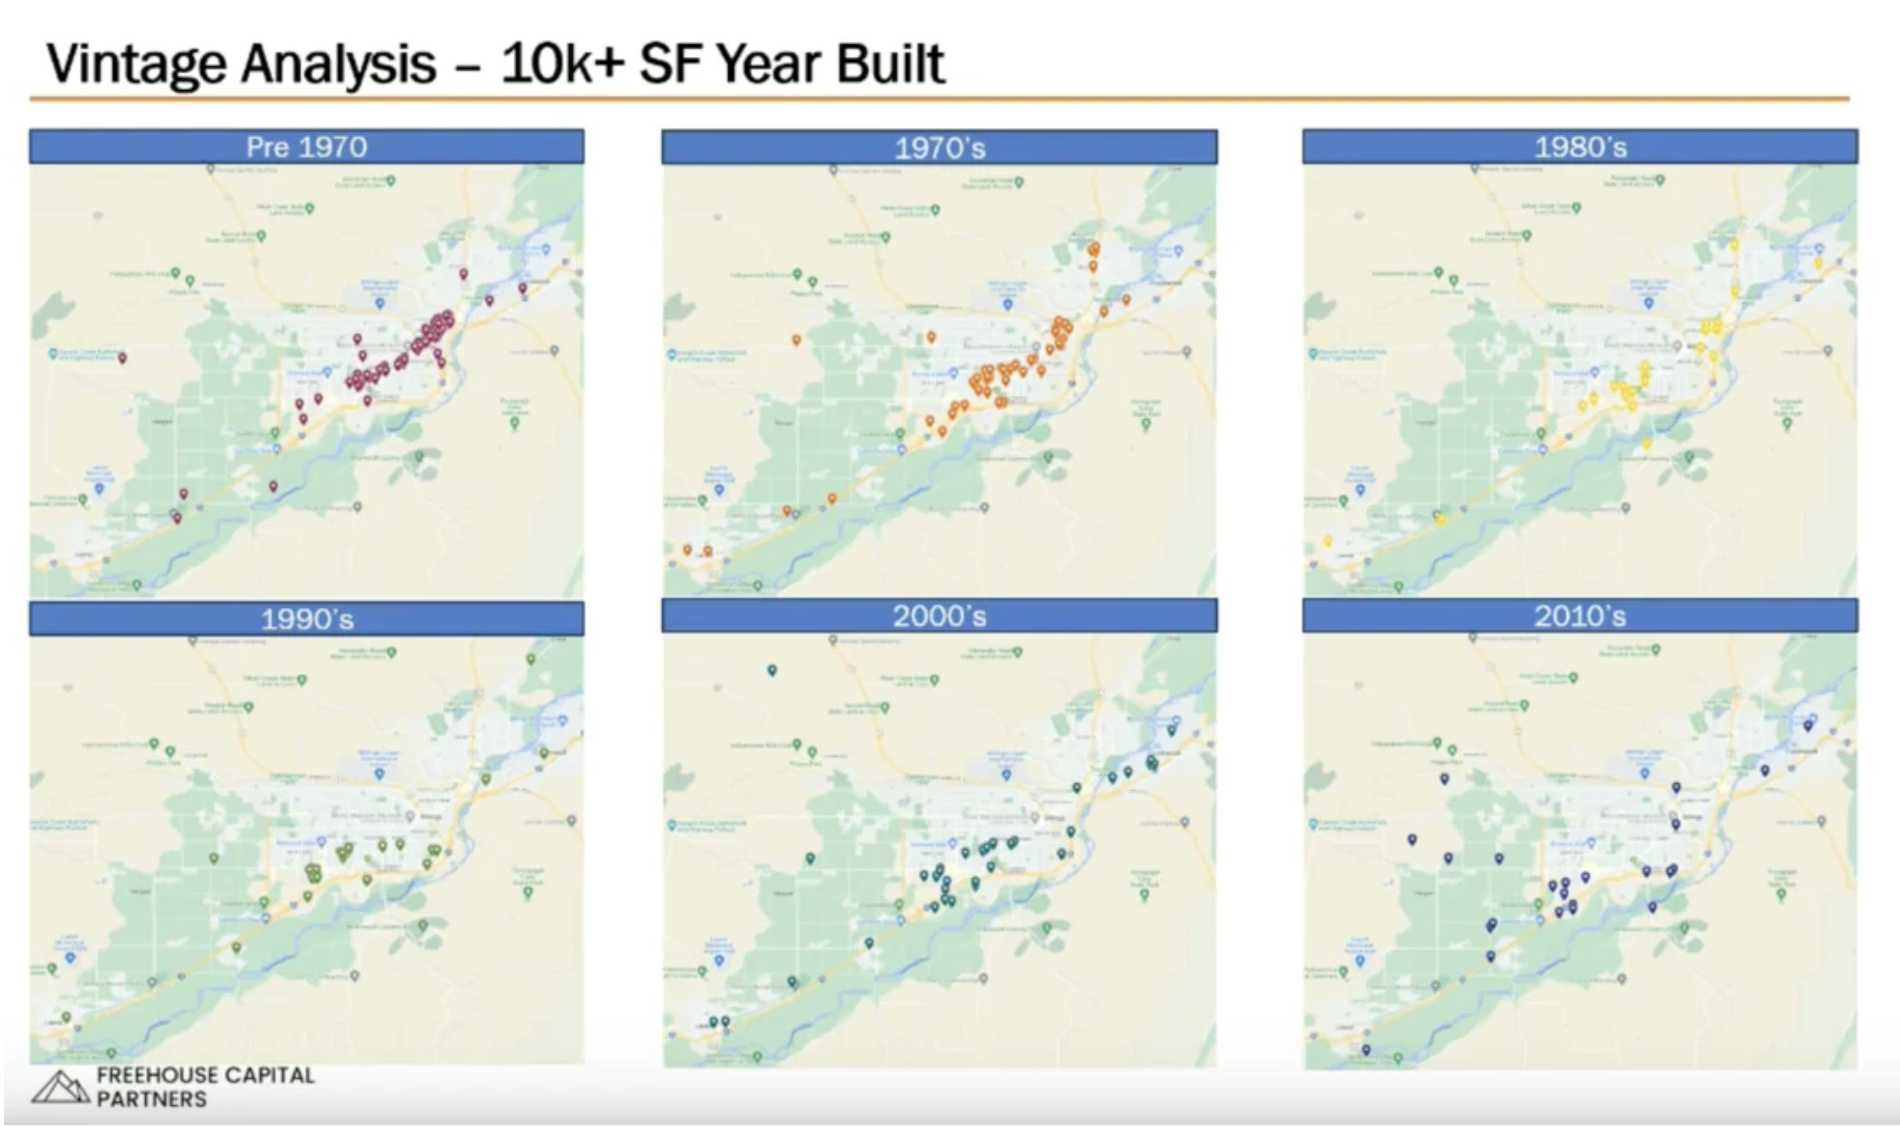
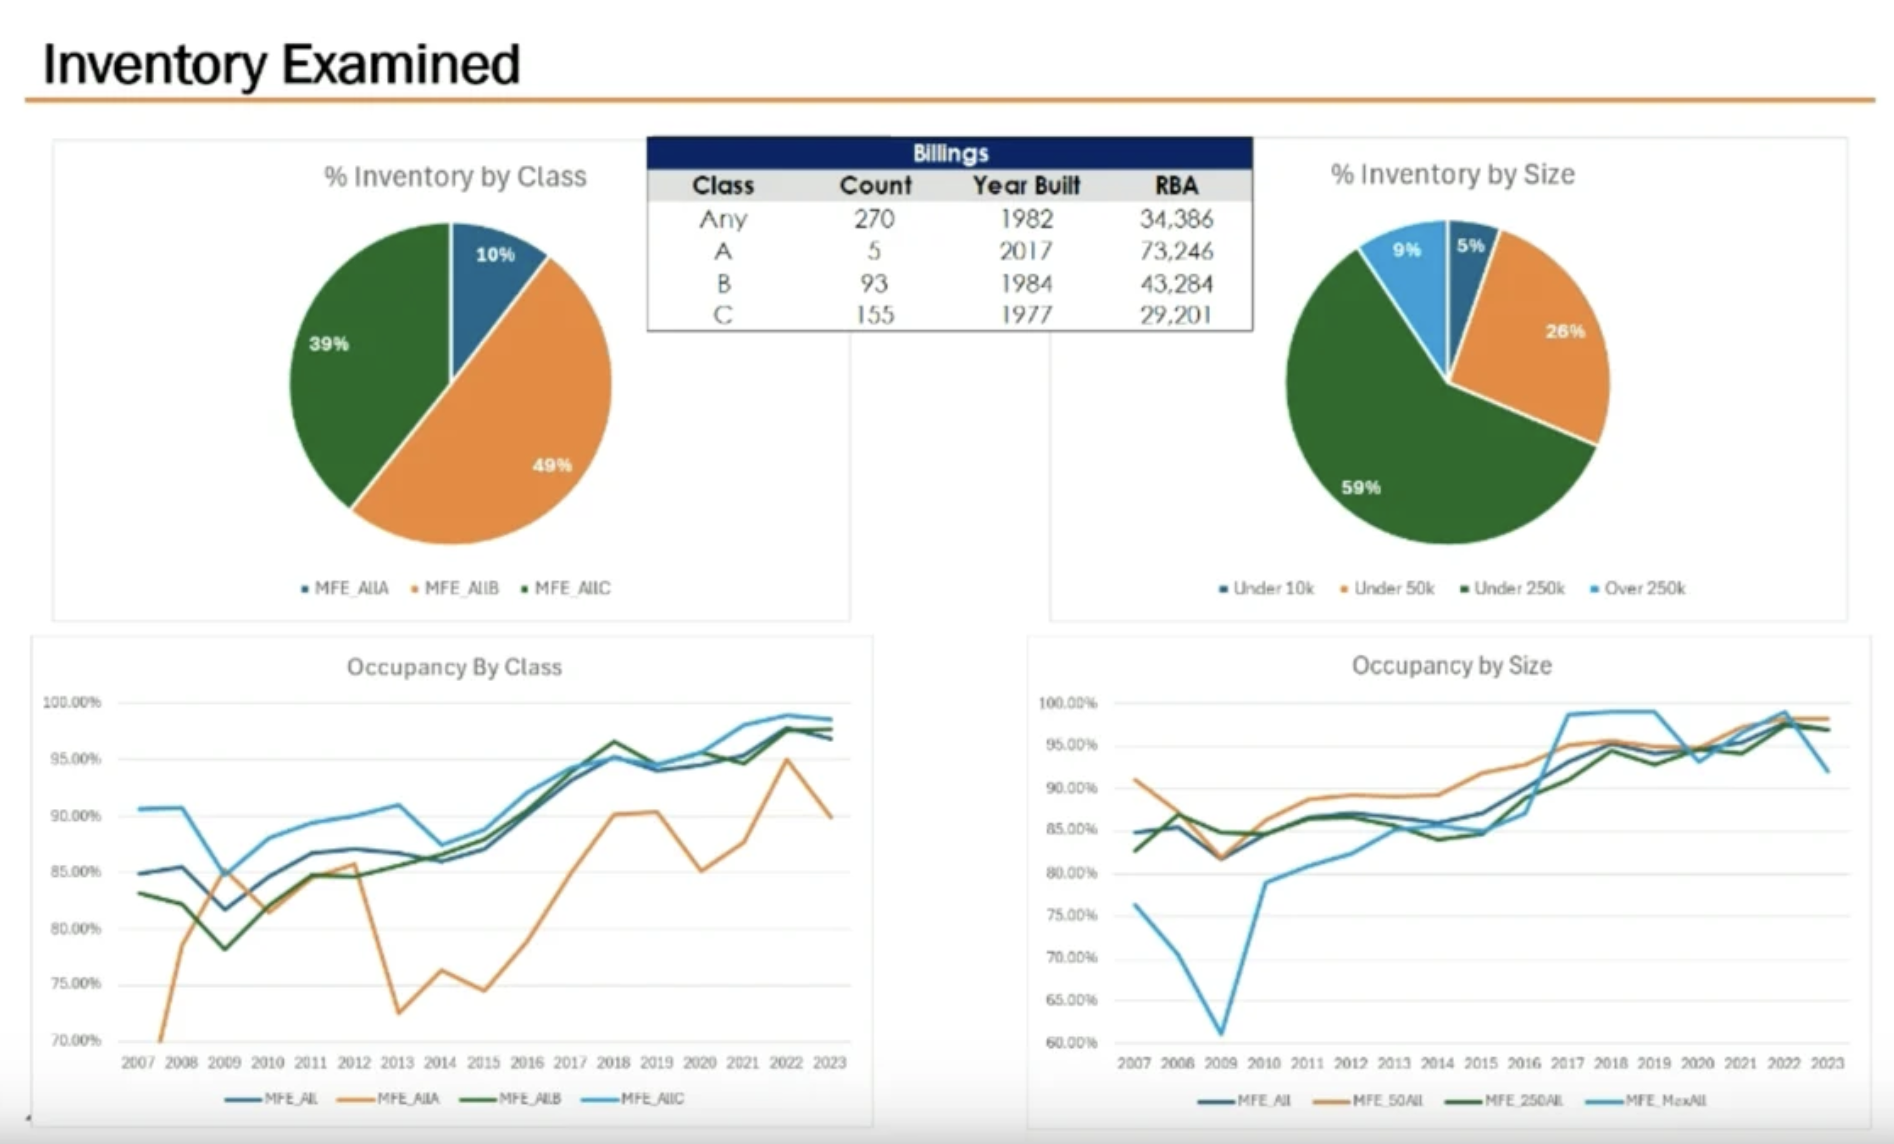
Billings holds 12 million square feet of industrial space, with an average new inventory of 100,000 square feet annually. A Class A project by TPA Group recently added around 300,000 square feet. Lease rates are between $8.95 and $9.50 per square foot.
Income Growth
Income in Billings has significantly grown due to proximity to Bakken oil fields and major refineries, with median incomes rising from $60,000 to $80,000 between 2018 and 2023.
Rent and Housing Affordability
Rent growth averages at 5% CAGR over the past five years. Median home price has increased by 54%, with median household income rising by 34.4%, indicating a healthier growth pattern than the national average.
In conclusion, Billings' economic growth is driven by stable population, industrial expansion, increased incomes, and a robust real estate market. These factors indicate a city ready for sustained success. We remain hopeful about Billings' potential for continuous growth, benefiting businesses and residents.
Thank you for reviewing our analysis. Feel free to share comments or questions.


